Have you got your diagnostics covered?

In standards such as ISO 26262, IEC 61508, and ISO 13849, quantitative analysis of system failure is a key activity. To achieve this a detailed definition of the safety mechanisms is required and over and above this the assessment of diagnostic capabilities which yields the diagnostic coverage. Through this diagnostic coverage (DC) a quantitative analysis of the residual failure can be achieved.
For hardware a quantitative allocation of failure in time (FIT) rates is a relatively straight forward activity. Standards such IEC TR 62380 (now incorporated into IEC 61709 and ISO 26262) IEC 61709 or Siemens SN 29500 amongst others, enable the calculation of FIT rates for a wide variety of electronic components, at different operating temperature and duty cycles i.e. mission profiles.
Field data from component manufacturers can be a less conservative source of failure rates, than failure rate standards and ultimately is the better route forward if the information is available.
Diagnostic coverage is generally divided up into 3 categories low 60%, medium up to 90% and high up to 99%. For approximation these three categories are a good starting point, however the activity can become far more scientific
In the digital world DC can be calculated from probabilities of errors based on the number of bits and error cases.
I.e. the number of incorrect address values in a register
Diagnostic coverage = 1 – probability of the number of errors
In the analogue world this becomes slightly more arm waving, but can still be estimated to a degree of accuracy based on expert judgement. The classic example for analogue DC being based on a power supply.
Various techniques can be used to analyse the residual FIT, combining the FIT with the diagnostic coverage. Fault tree analysis (FTA) being an example of a deductive approach (top down) and failure mode and effects diagnostic analysis (FMEDA) being an inductive approach (bottom up).
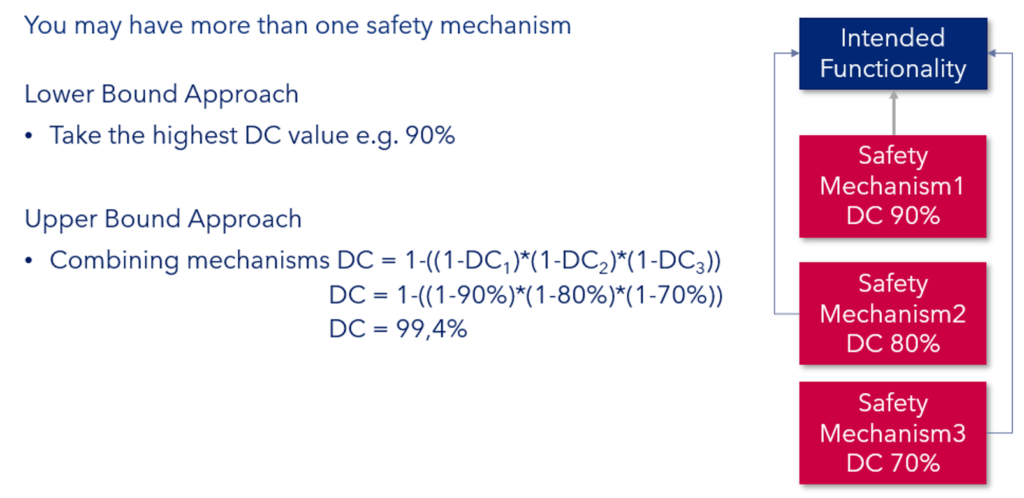
For many device failures there are multiple mechanisms that can detect or mitigate a failure. So how do we incorporate the benefits of having multiple mechanisms?
There are different ways that multiple DC can be assessed: upper bounded combines each DC as indicated in Figure 1. This method yields the highest value of the different techniques, but is a dependant on factors such as independence between mechanisms. Lower bounded is the simplest approach, taking the highest individual diagnostic coverage for the calculation, thus making the exercise simpler but may result in a too pessimistic approach. This technique can also lead to additional unnecessary safety mechanisms not being evaluated and potentially eliminated from a product to keep costs down.
There are other techniques over and above upper and lower bound, these include average or normalised diagnostic coverage and there is always the option of measuring diagnostic coverage through e.g. fault injection tests.
Ultimately the assessment of combined diagnostic coverage may illustrate that there is excessive coverage and hence reducing the number of mechanisms may reduce system costs.
IEC 60601-1 does list the term diagnostic coverage in section 14.8 on programable medical electrical systems (PEMS) architecture, but there is unfortunately no expansion of the term nor how to approach it. Most medical device companies approach risk in a qualitative rather than quantitative manner.
However, for higher risk classification products such as pacemakers and defibrillators such quantitative techniques are important to establish the residual risk for the devices. Ultimately the risk management standard ISO 14971 does define quantitative data as preferrable to qualitative data and a FMEDA approach based purely single point faults is a good approach.
In summary diagnostic coverage can yield a relatively simple approach for quantitative analysis of systems. Combining diagnostic coverage also enables improved diagnostic analysis and also the assessment of excessive usage of safety mechanisms.
In a subsequent blog we will look at reliability, availability, maintainability and safety (RAMS) a topic that links the worlds of safety and reliability.
By Alastair Walker, Consultant and Owner
Do you want to learn more about the implementation of ISO 26262, IEC 60601, ISO 14971 or any other standard in the Automotive or Medical Device sector? We work remotely with you. Please contact us at info@lorit-consultancy.com for bespoke consultancy or join one of our upcoming online courses.
Address Austria:
Lorit Consultancy GmbH
Siezenheimer Straße 35
5020 Salzburg / Austria
Address UK:
Lorit Consultancy Ltd
1 Craigathie Road
Roslin Midlothian / Scotland EH25 9BG